StreetStyle: Exploring world-wide clothing styles from millions of photos
Kevin Matzen Kavita Bala Noah Snavely
Cornell University
[Paper] [Demo Trend Visualizer] [Example Analyses]
Abstract
Each day billions of photographs are uploaded to photo-sharing services. These images are packed with information about how people live around the world. In this paper we exploit this rich trove of data for understanding fashion and style trends worldwide. We present a framework for visual discovery at scale analyzing clothing and fashion across millions of images of people around the world and spanning several years. We introduce a large-scale dataset of photos of people annotated with clothing attributes, and use this dataset to train attribute classifiers via deep learning. We also present a method for discovering visually consistent style clusters that capture useful visual correlations in this massive dataset. Given these tools, we analyze millions of photos to derive visual insight, producing a first-of-its-kind analysis of global and per-city fashion choices and spatio-temporal trends.
Paper [pdf]
Kevin Matzen, Kavita Bala, and Noah Snavely. "StreetStyle:
Exploring world-wide clothing styles from millions of photos". In arXiv, 2017.
@article{StreetStyle2017,
title={{StreetStyle}: {E}xploring world-wide clothing styles from millions of photos},
author={Kevin Matzen and Kavita Bala and Noah Snavely},
journal={arXiv preprint arXiv:1706.01869},
year={2017}
}
Example Style Analyses
Example 1: Plotting clothing attributes over time
One simple but powerful analysis out method enables is to plot the frequency of any given clothing attribute over time, for a particular city (see our demo page to explore many more. For instance, the plot below shows the frequency of observing people wearing primarily white clothing in NYC over time: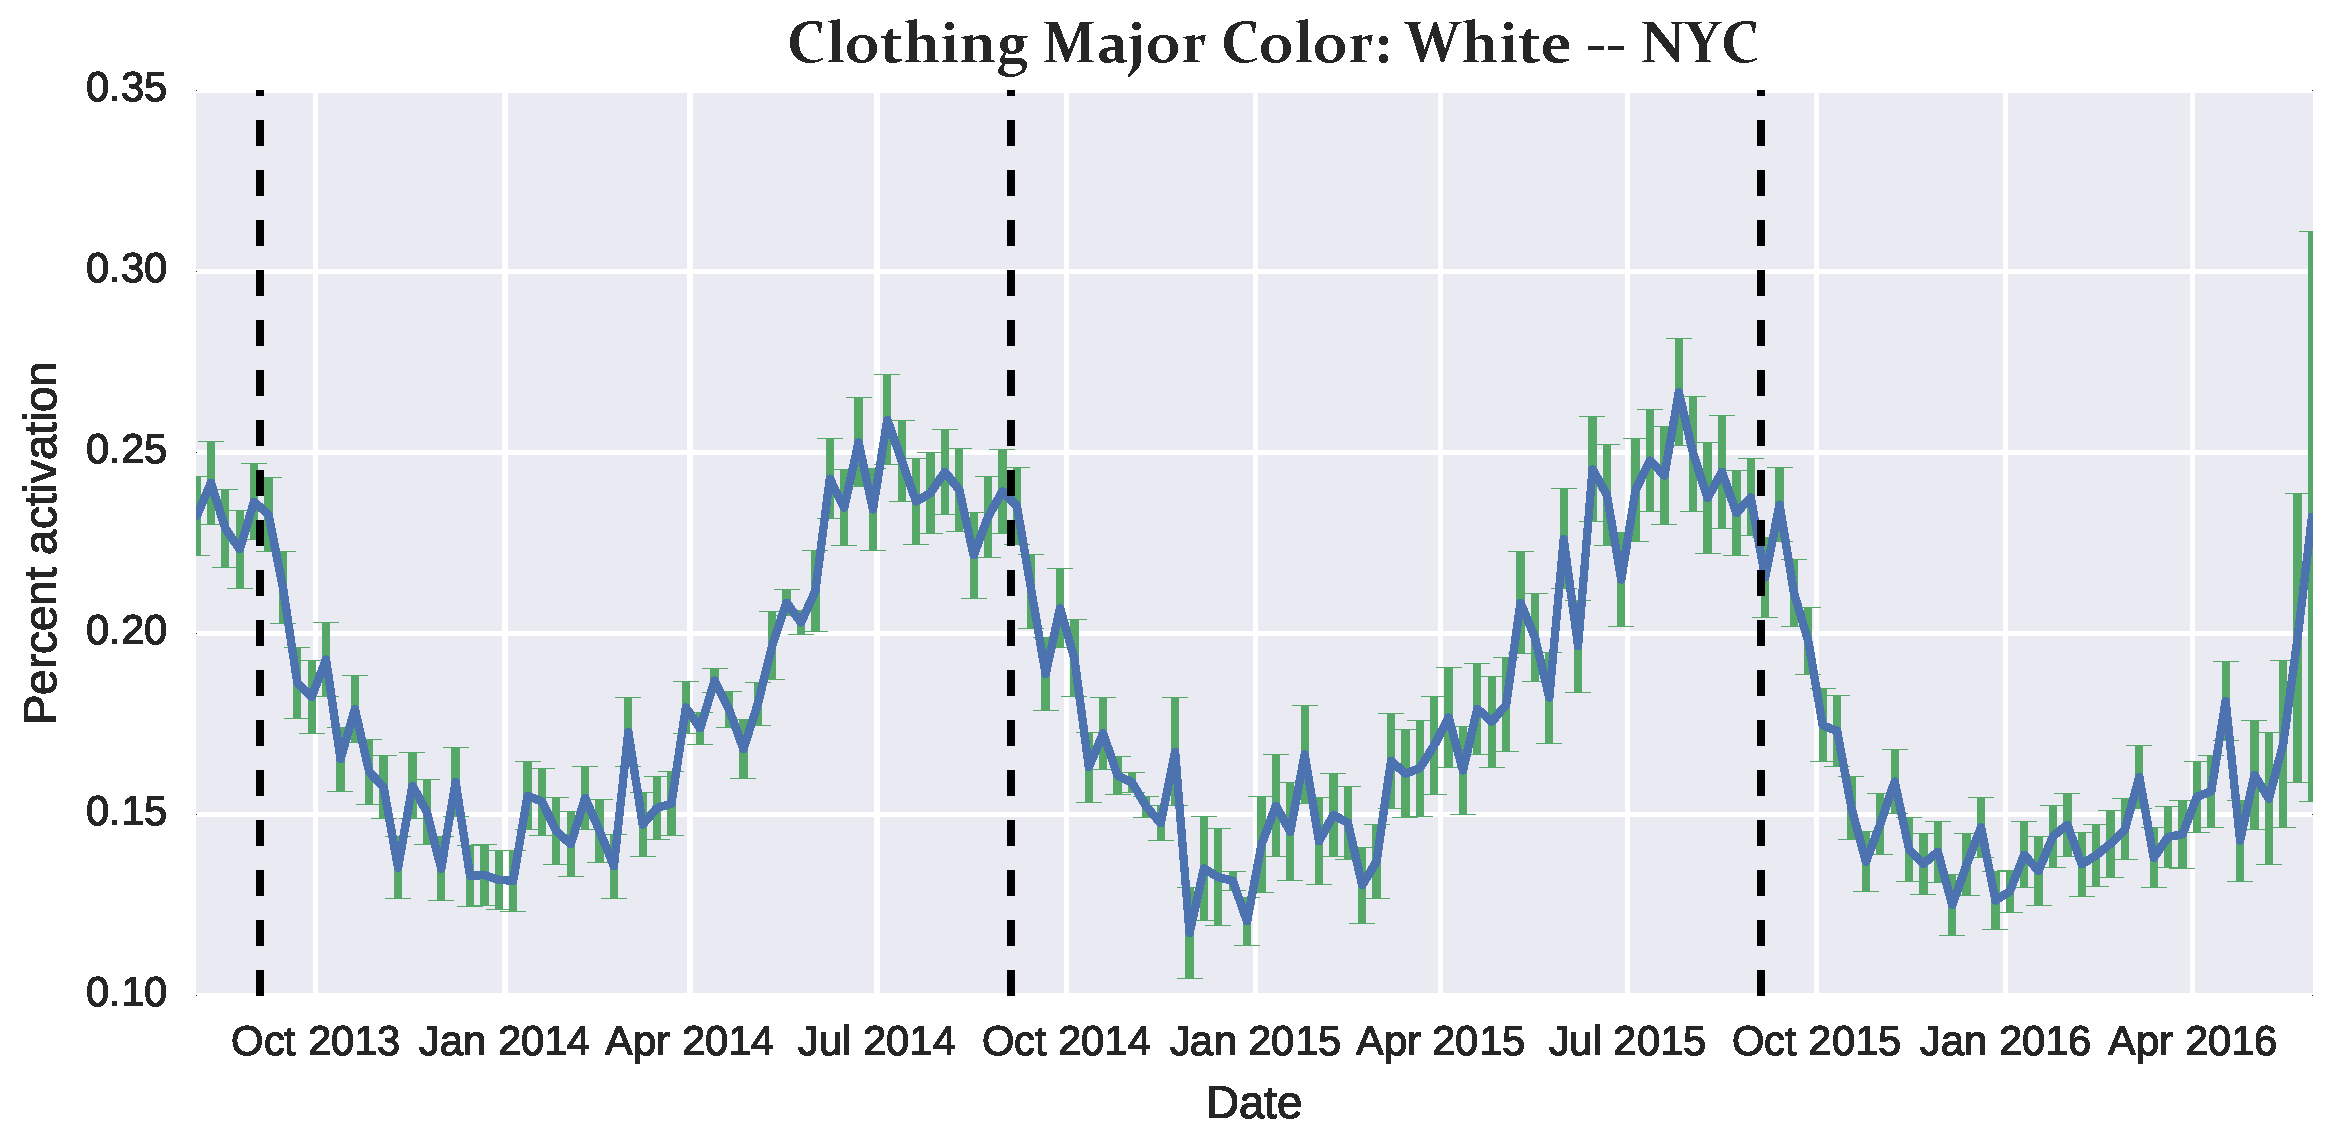
Example 2: Automatically detected style clusters ranked by space-time entropy
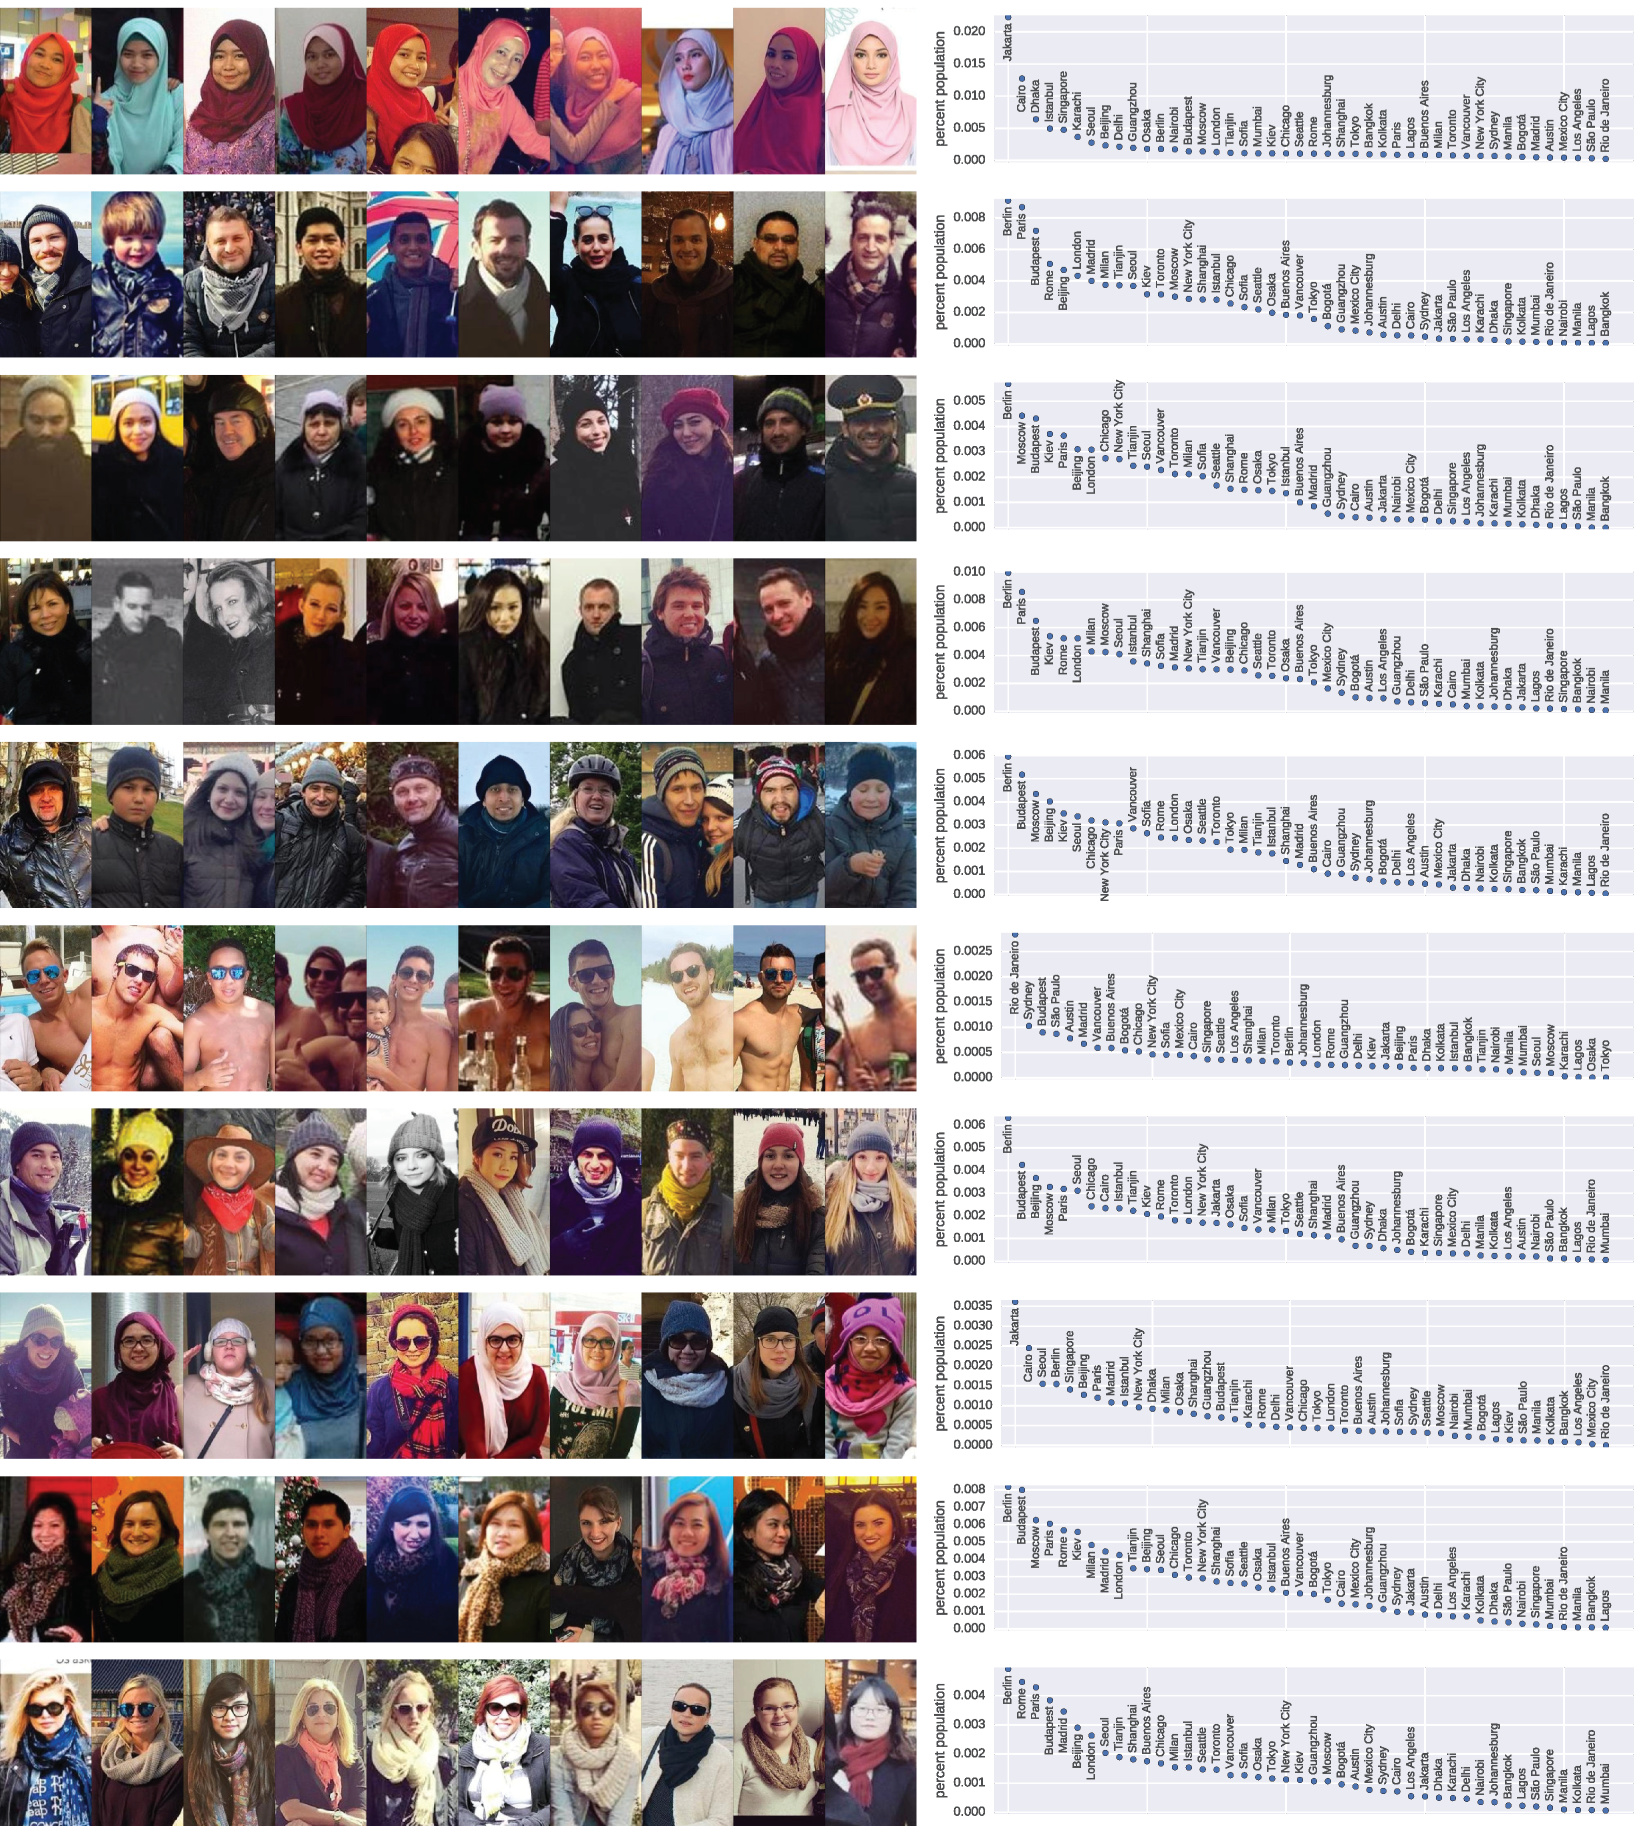
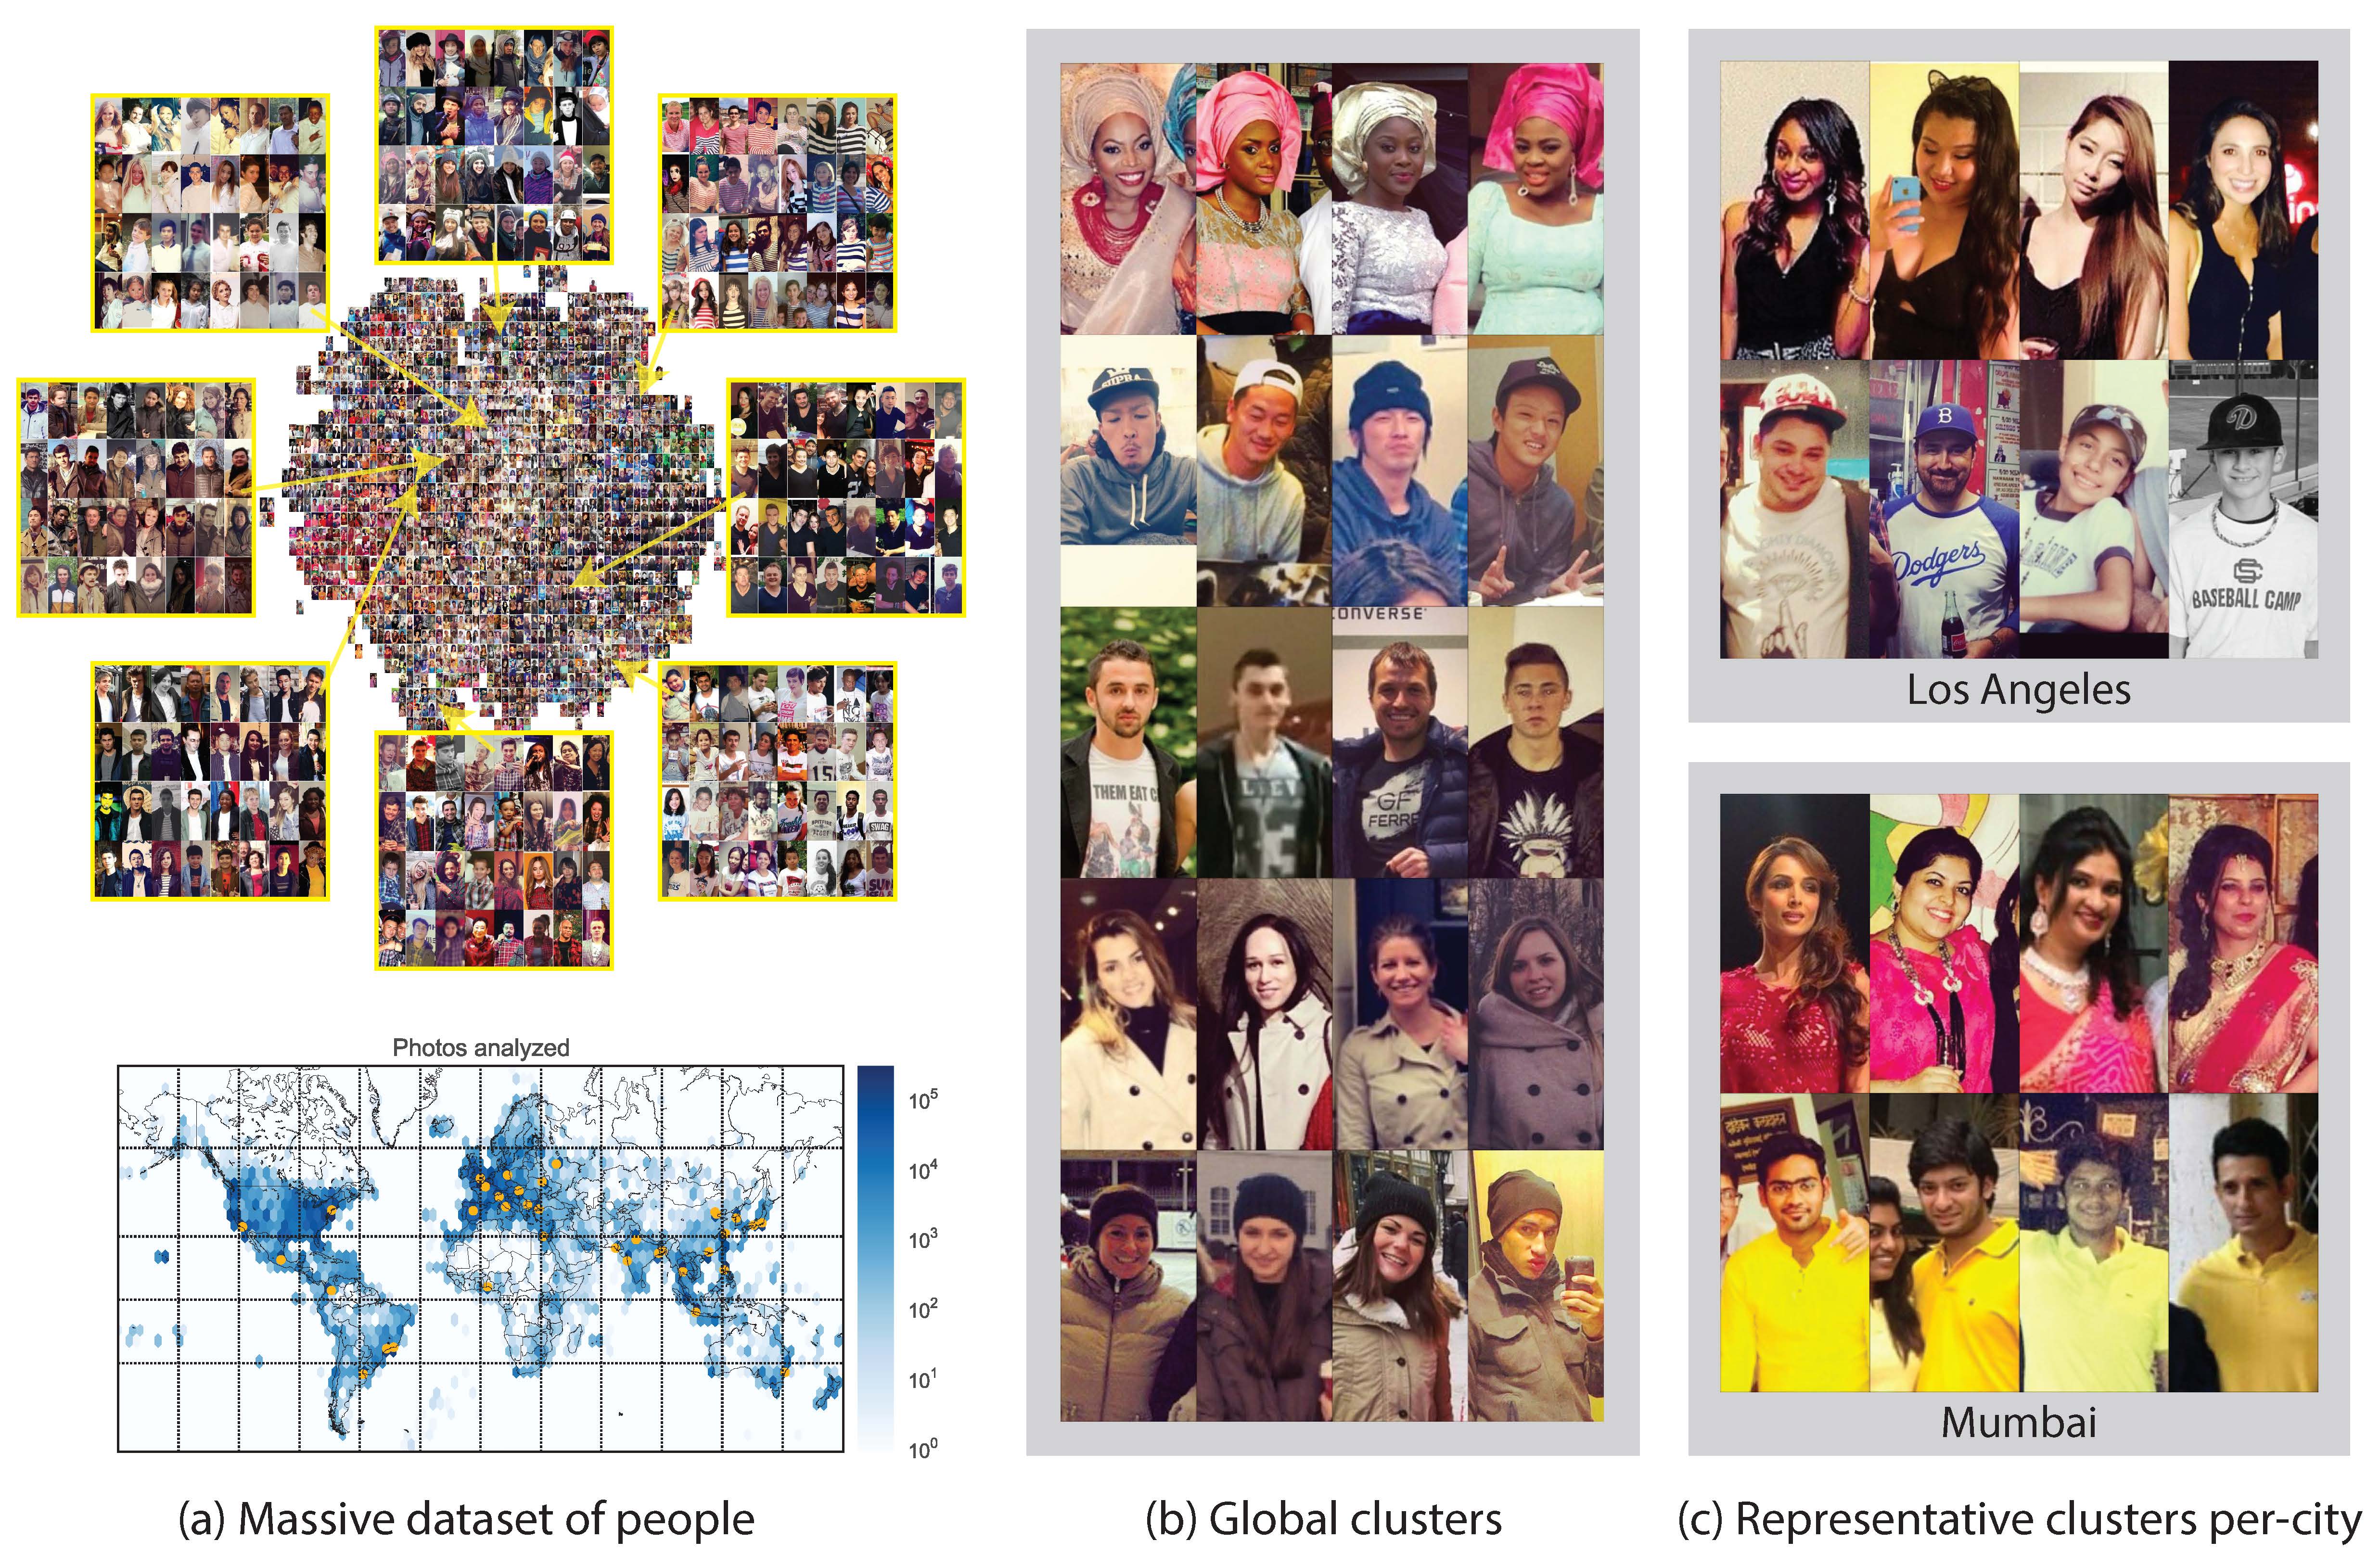
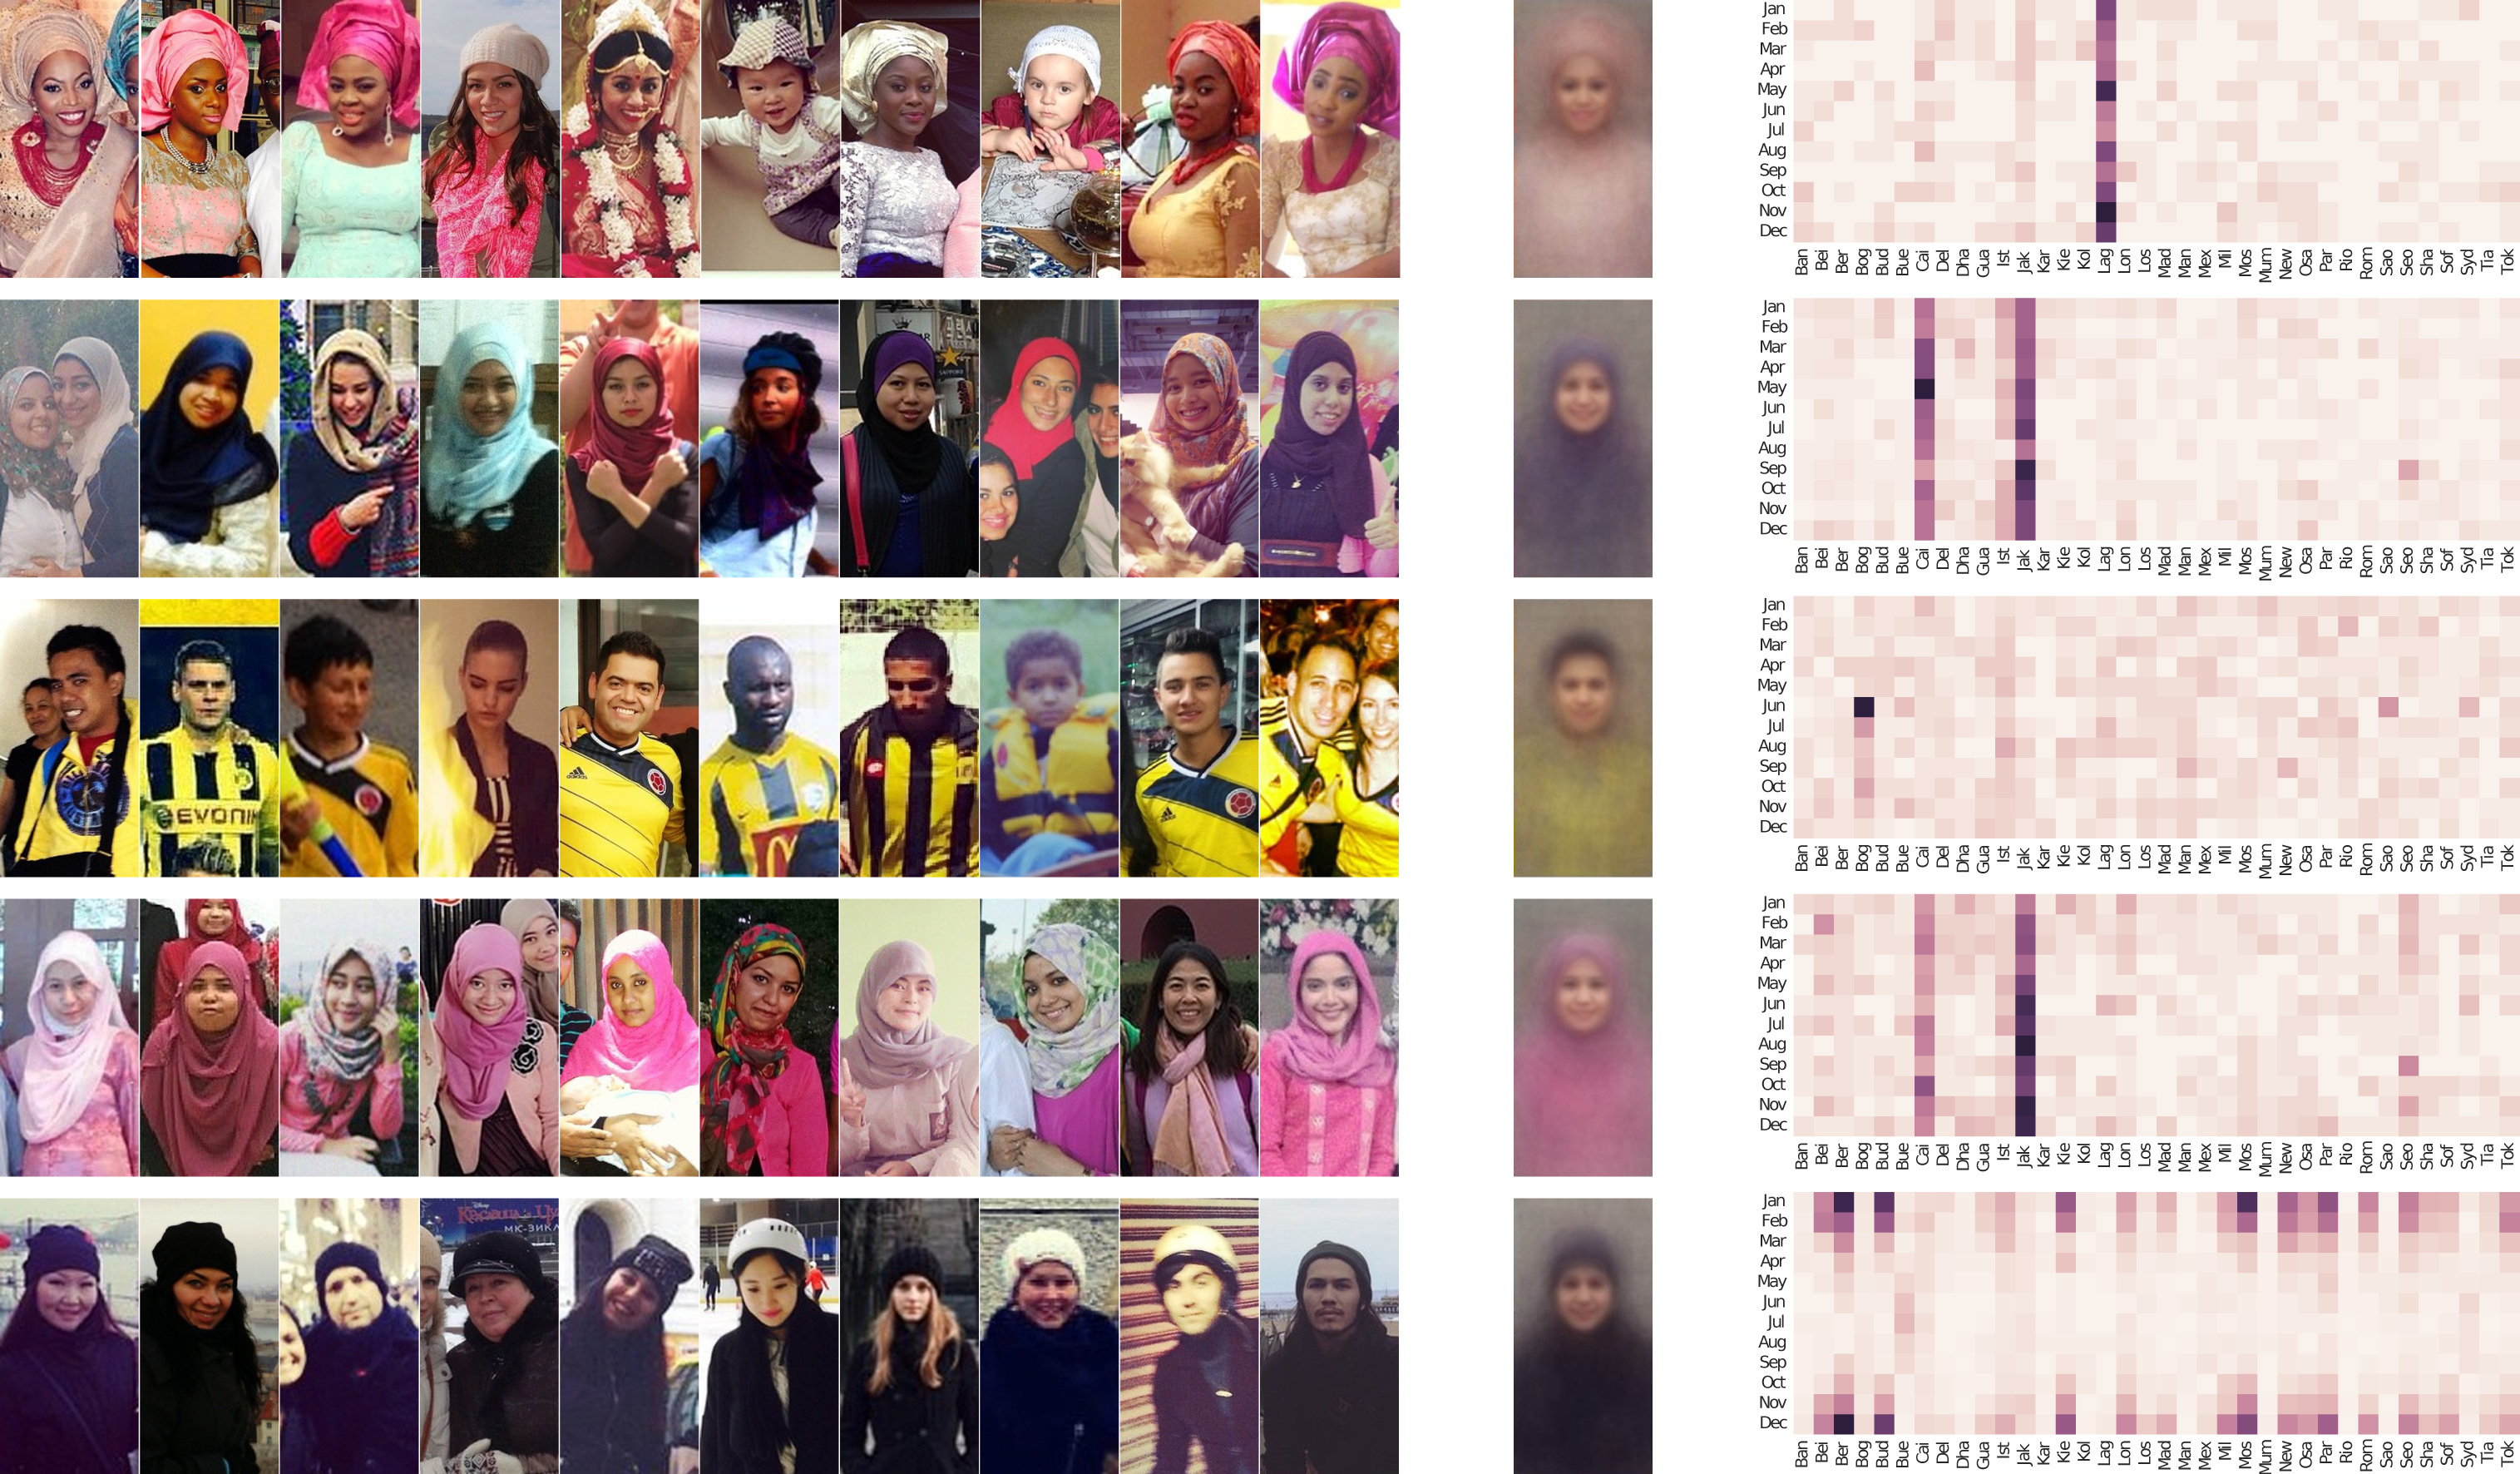
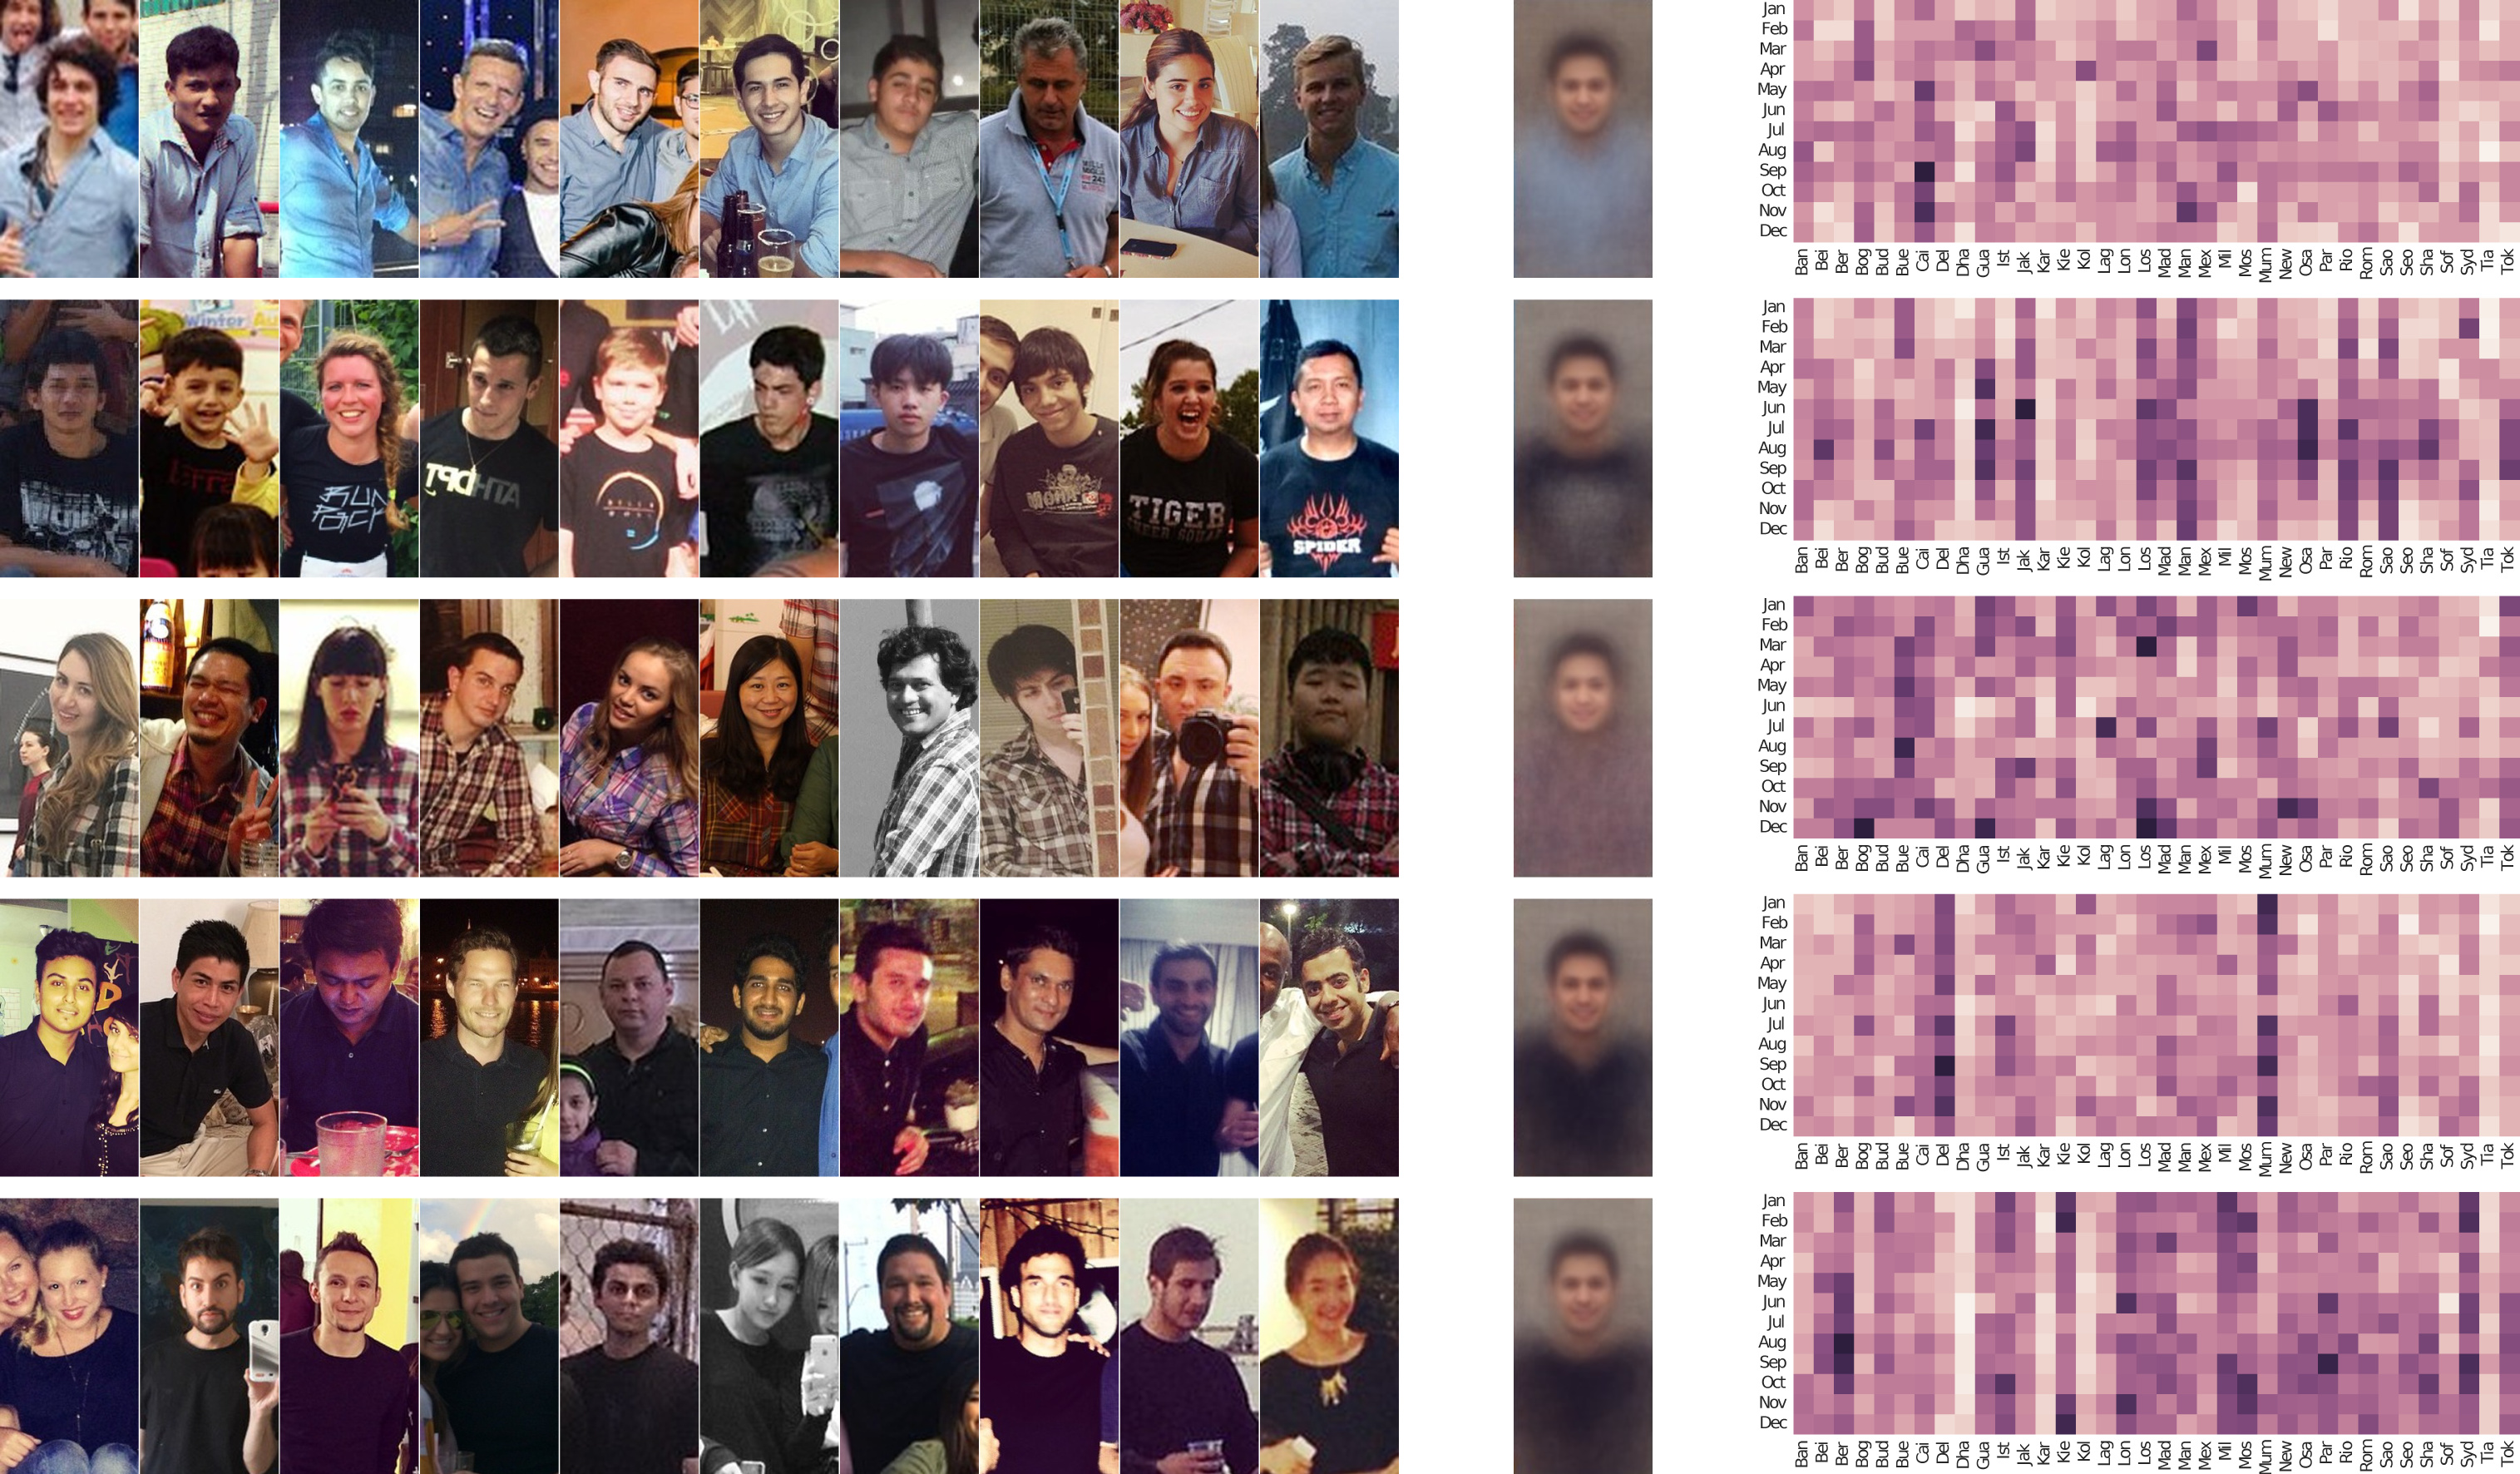
In our deep-learned style feature space, we perform clustering to identify images with similar style attributes, automatically discovering images with related styles. We can then analyze the occurrence of these “style clusters” across space and time. Below, we show several examples of clusters sorted by how distinctive they are in space and time.
Style clusters with the highest space-time entropy. Below we show the clusters that are the least distinctive in terms of place and time, i.e., that tend to be observed at many times and places, as can be seen in their corresponding space-time histograms. These correspond to clothing such as blue collared shirts, plaid shirts, and black T-shirts.
Style clusters with the lowest entropy over cities. Below, we show the clusters that are the most distinctive in terms of city. Each cluster contains thousands of people so we visually summarize them by the people closest to the cluster center (left), and the histogram of all people in the cluster across each city (right).